

How to Build a Grafana OSS Observability Stack (Prometheus, Loki, Tempo) on Ubuntu 24.04
Deploy Prometheus, Loki, Tempo and Grafana with Docker Compose, instrument a demo app to emit metrics, logs and traces, and correlate all three signals from a single dashboard.
What You’ll Accomplish
You’ll stand up a complete self-hosted observability stack on a single Ubuntu 24.04 machine and prove all three telemetry signals actually work together. Specifically:
- Prometheus for metrics, Loki for logs, Tempo for traces, Grafana to query them
- Grafana Alloy collecting all three signals — replacing Promtail, which reached end of life
- A demo service instrumented with OpenTelemetry, producing correlated metrics, logs, and traces
- A dashboard where you follow one slow request from a latency spike down to the exact failing span and the log line explaining it
The versions below are the ones I actually ran. I picked them deliberately, because the naive latest tag is a trap right now:
| Component | Version used | Why that version |
|---|---|---|
| Grafana | 13.2.1 | Current minor release |
| Prometheus | v3.13.4 | The 3.13 LTS branch, supported to 2027-07-31 |
| Loki | 3.7.8 | Current 3.7 patch |
| Tempo | 2.9.0 | Adds TraceQL metrics sampling hints |
| Alloy | v1.13.1 | Current collector |
| Node exporter | v1.9.1 | Host metrics |
As of this writing the newest Prometheus is 3.15.0, but that release line reaches end of support on 6 November 2026. The supported branch is 3.13, the current LTS, which receives fixes until 31 July 2027. Pulling prom/prometheus:latest gives you a release that stops getting security patches within weeks. See the Prometheus LTS policy.
This is a single-node, filesystem-backed deployment — fine for a home lab or a proof of concept, not a production topology. Tempo’s block retention is set to one hour and Prometheus to six hours, both sized for a demo.
Prerequisites
- Ubuntu 24.04 (I used a clean 24.04.3 LTS VM) with at least 4 vCPU, 8 GB RAM, and 20 GB free disk
sudoprivileges- Outbound access to Docker Hub for the images
Verify your base system first:
grep PRETTY /etc/os-release
free -h
df -h /
1. Install Docker Engine
Add Docker’s official repository and install the engine. On Ubuntu 24.04 the codename is noble:
sudo apt update
sudo apt install -y ca-certificates curl
sudo install -m 0755 -d /etc/apt/keyrings
sudo curl -fsSL https://download.docker.com/linux/ubuntu/gpg -o /etc/apt/keyrings/docker.asc
sudo chmod a+r /etc/apt/keyrings/docker.asc

sudo tee /etc/apt/sources.list.d/docker.sources >/dev/null <<EOF
Types: deb
URIs: https://download.docker.com/linux/ubuntu
Suites: $(. /etc/os-release && echo "${UBUNTU_CODENAME:-$VERSION_CODENAME}")
Components: stable
Architectures: $(dpkg --print-architecture)
Signed-By: /etc/apt/keyrings/docker.asc
EOF

sudo apt update
sudo apt install -y docker-ce docker-ce-cli containerd.io docker-buildx-plugin docker-compose-plugin
Add yourself to the docker group so you don’t need sudo for every command, then log out and back in (or run newgrp docker):
sudo usermod -aG docker $USER
Confirm the engine is healthy:
docker --version
docker compose version
sudo systemctl is-active docker
sudo docker run --rm hello-world
My run produced:
Docker version 29.8.2, build 7fc2dff
Docker Compose version v5.6.0
active
That hello-world line matters — it’s the only proof that the daemon can actually pull and run a container, as opposed to merely having packages installed.
2. Lay out the project
mkdir -p ~/grafstack/{prometheus,loki,tempo,alloy,app,logs}
cd ~/grafstack
~/grafstack
├── docker-compose.yml
├── alloy/config.alloy
├── app/{app.py,Dockerfile,requirements.txt}
├── logs/                     # demo app writes here; Alloy tails it
├── loki/loki-config.yaml
├── prometheus/prometheus.yml
└── tempo/tempo.yaml
The logs/ directory matters: both the app and Alloy bind-mount it, so Alloy can read what the app writes.
3. Configure the three storage backends
Prometheus — scrape config for the app, node exporter, Alloy itself, and its own self-scrape. The remote-write receiver flag is what lets Alloy push metrics in:
# prometheus/prometheus.yml
global:
  scrape_interval: 10s
  evaluation_interval: 10s

scrape_configs:
  - job_name: prometheus
    static_configs:
      - targets: ['localhost:9090']

  - job_name: node
    static_configs:
      - targets: ['node-exporter:9100']

  - job_name: alloy
    static_configs:
      - targets: ['alloy:12345']

  - job_name: demo-app
    static_configs:
      - targets: ['demo-app:8000']
Loki — filesystem storage with the TSDB schema:
# loki/loki-config.yaml
auth_enabled: false

server:
  http_listen_port: 3100
  log_level: warn

common:
  instance_addr: 127.0.0.1
  path_prefix: /loki
  storage:
    filesystem:
      chunks_directory: /loki/chunks
      rules_directory: /loki/rules
  replication_factor: 1
  ring:
    kvstore:
      store: inmemory

schema_config:
  configs:
    - from: 2024-01-01
      store: tsdb
      object_store: filesystem
      schema: v13
      index:
        prefix: index_
        period: 24h

limits_config:
  reject_old_samples: false
  allow_structured_metadata: true
  volume_enabled: true

analytics:
  reporting_enabled: false
Tempo — OTLP receiver on 4317/4318, local trace storage. The metrics_generator block is what eventually makes traces appear alongside metrics and service graphs:
# tempo/tempo.yaml
stream_over_http_enabled: true

server:
  http_listen_port: 3200
  log_level: warn

distributor:
  receivers:
    otlp:
      protocols:
        grpc:
          endpoint: 0.0.0.0:4317
        http:
          endpoint: 0.0.0.0:4318

ingester:
  max_block_duration: 5m

compactor:
  compaction:
    block_retention: 1h

metrics_generator:
  registry:
    external_labels:
      source: tempo
  storage:
    path: /var/tempo/generator/wal
    remote_write:
      - url: http://prometheus:9090/api/v1/write
        send_exemplars: true

storage:
  trace:
    backend: local
    wal:
      path: /var/tempo/wal
    local:
      path: /var/tempo/blocks

usage_report:
  reporting_enabled: false
4. Write the Alloy collector config
Alloy is a single collector that scrapes metrics, tails files, and can receive OTLP. It replaced both Grafana Agent (end of life 1 Nov 2025) and Promtail (end of life 2 Mar 2026).
# alloy/config.alloy
logging {
  level  = "info"
  format = "logfmt"
}

// --- Host metrics ---------------------------------------------------------
prometheus.exporter.unix "node" {}

discovery.relabel "node" {
  targets = prometheus.exporter.unix.node.targets
}

prometheus.scrape "node" {
  targets    = discovery.relabel.node.output
  forward_to = [prometheus.remote_write.default.receiver]
}

// Alloy's own internal metrics, read from its HTTP server.
discovery.relabel "self" {
  targets = [{
    __address__ = "alloy:12345",
    job        = "alloy",
  }]
}

prometheus.scrape "self" {
  targets         = discovery.relabel.self.output
  forward_to      = [prometheus.remote_write.default.receiver]
  scrape_interval = "10s"
}

// --- Demo app ------------------------------------------------------------
discovery.relabel "demo" {
  targets = [{
    __address__ = "demo-app:8000",
    job        = "demo-app",
  }]
}

prometheus.scrape "demo" {
  targets    = discovery.relabel.demo.output
  forward_to = [prometheus.remote_write.default.receiver]
}

// --- Logs ----------------------------------------------------------------
loki.source.file "app_logs" {
  targets = [{
    __path__ = "/var/log/app/*.log",
    job      = "demo-app",
  }]
  forward_to = [loki.write.default.receiver]

  file_match {
    enabled     = true
    sync_period = "10s"
  }
}

loki.write "default" {
  endpoint {
    url = "http://loki:3100/loki/api/v1/push"
  }
}

// --- Remote write --------------------------------------------------------
prometheus.remote_write "default" {
  endpoint {
    url = "http://prometheus:9090/api/v1/write"
  }
}
Without file_match { enabled = true }, Alloy passes *.log to stat() literally and fails with:
failed to create source, skipping  error="failed to tail file, stat failed:
stat /var/log/app/*.log: no such file or directory"
Glob expansion in __path__ only happens once file discovery is switched on. The alternative is a separate local.file_match component, but file_match is simpler. See loki.source.file.
5. Build the instrumented demo app
A Flask service with three routes, each emitting metrics, structured JSON logs, and nested spans. One in five /checkout calls takes a deliberately slow path so you have a real error to chase.
# app/app.py
"""Demo API instrumented with OpenTelemetry: metrics + logs + traces, correlated."""
import logging
import os
import random
import time

from flask import Flask, jsonify
from prometheus_client import CONTENT_TYPE_LATEST, Counter, Histogram, generate_latest
from opentelemetry import trace
from opentelemetry.exporter.otlp.proto.grpc.trace_exporter import OTLPSpanExporter
from opentelemetry.instrumentation.flask import FlaskInstrumentor
from opentelemetry.instrumentation.logging import LoggingInstrumentor
from opentelemetry.sdk.resources import Resource
from opentelemetry.sdk.trace import TracerProvider
from opentelemetry.sdk.trace.export import BatchSpanProcessor

logging.basicConfig(
    level=logging.INFO,
    format='{"level":"%(levelname)s","service":"demo-app","msg":"%(message)s"}',
    stream=open("/var/log/app/demo.log", "a", buffering=1),
)
log = logging.getLogger("demo-app")

resource = Resource.create({"service.name": "demo-app", "service.version": "1.0.0"})

tp = TracerProvider(resource=resource)
tp.add_span_processor(BatchSpanProcessor(
    OTLPSpanExporter(endpoint=os.environ["OTEL_EXPORTER_OTLP_ENDPOINT"], insecure=True)))
trace.set_tracer_provider(tp)
tracer = trace.get_tracer("demo-app")

requests_total = Counter("demo_requests_total", "Requests handled", ["route"])
failures_total = Counter("demo_failures_total", "Failed requests", ["route"])
duration = Histogram("demo_request_duration_seconds", "Request latency", ["route"])

app = Flask(__name__)
FlaskInstrumentor().instrument_app(app)
LoggingInstrumentor().instrument(set_logging_format=False)


@app.route("/metrics")
def metrics():
    return generate_latest(), 200, {"Content-Type": CONTENT_TYPE_LATEST}


@app.route("/")
def index():
    with tracer.start_as_current_span("index"):
        requests_total.labels(route="/").inc()
        log.info("serving index request")
        return jsonify(service="demo-app", status="ok")


@app.route("/checkout")
def checkout():
    # 1 in 5 checkouts simulates a slow downstream dependency
    slow = random.random() < 0.2
    started = time.time()
    with tracer.start_as_current_span("checkout") as span:
        span.set_attribute("checkout.slow", slow)
        with tracer.start_as_current_span("db.query"):
            time.sleep(random.uniform(0.05, 0.15))
        with tracer.start_as_current_span("payment.authorize"):
            time.sleep(random.uniform(0.5, 1.2) if slow else random.uniform(0.01, 0.05))
        requests_total.labels(route="/checkout").inc()
        if slow:
            failures_total.labels(route="/checkout").inc()
            span.set_status(trace.Status(trace.StatusCode.ERROR, "downstream timeout"))
            log.error("payment authorization slow path taken")
        else:
            log.info("checkout completed successfully")
        duration.labels(route="/checkout").observe(time.time() - started)
        return jsonify(status="declined" if slow else "ok", slow=slow)


if __name__ == "__main__":
    app.run(host="0.0.0.0", port=8000)
# app/requirements.txt
flask==3.0.3
opentelemetry-api==1.29.0
opentelemetry-sdk==1.29.0
opentelemetry-instrumentation-flask==0.50b0
opentelemetry-instrumentation-logging==0.50b0
opentelemetry-exporter-otlp-proto-grpc==1.29.0
opentelemetry-exporter-prometheus==0.50b0
prometheus-client==0.21.1
# app/Dockerfile
FROM python:3.12-slim
WORKDIR /app
COPY requirements.txt .
RUN pip install --no-cache-dir -r requirements.txt
COPY app.py .
CMD ["python", "app.py"]
The OpenTelemetry PrometheusMetricReader listens on port 9464 by default, not on your app’s port. If you point Prometheus at demo-app:8000/metrics while leaving the default in place, the target scrapes your Flask app, gets a 404 NOT FOUND, and the job sits at down with no obvious cause. Serving /metrics yourself with prometheus_client (as above) keeps the metric endpoint on the same port as the app and gives you explicit control.
6. Write the Compose file
# docker-compose.yml
name: grafstack

services:
  prometheus:
    image: prom/prometheus:v3.13.4
    command:
      - --config.file=/etc/prometheus/prometheus.yml
      - --storage.tsdb.path=/prometheus
      - --storage.tsdb.retention.time=6h
      - --web.enable-remote-write-receiver
      - --web.enable-lifecycle
    volumes:
      - ./prometheus/prometheus.yml:/etc/prometheus/prometheus.yml:ro
      - prom-data:/prometheus
    ports:
      - "9090:9090"

  loki:
    image: grafana/loki:3.7.8
    command: -config.file=/etc/loki/loki-config.yaml
    volumes:
      - ./loki/loki-config.yaml:/etc/loki/loki-config.yaml:ro
      - loki-data:/loki
    ports:
      - "3100:3100"

  tempo:
    image: grafana/tempo:2.9.0
    command: -config.file=/etc/tempo/tempo.yaml
    volumes:
      - ./tempo/tempo.yaml:/etc/tempo/tempo.yaml:ro
      - tempo-data:/var/tempo
    ports:
      - "3200:3200"
      - "4317:4317"
      - "4318:4318"

  alloy:
    image: grafana/alloy:v1.13.1
    command:
      - run
      - --server.http.listen-addr=0.0.0.0:12345
      - --storage.path=/var/lib/alloy/data
      - /etc/alloy/config.alloy
    volumes:
      - ./alloy/config.alloy:/etc/alloy/config.alloy:ro
      - alloy-data:/var/lib/alloy/data
      - ./logs:/var/log/app:ro
    ports:
      - "12345:12345"
    depends_on:
      - prometheus
      - loki

  grafana:
    image: grafana/grafana:13.2.1
    environment:
      GF_SECURITY_ADMIN_USER: admin
      GF_SECURITY_ADMIN_PASSWORD: grafstackdemo
      GF_USERS_ALLOW_SIGN_UP: "false"
    volumes:
      - grafana-data:/var/lib/grafana
    ports:
      - "3000:3000"
    depends_on:
      - prometheus
      - loki
      - tempo

  demo-app:
    build: ./app
    environment:
      OTEL_EXPORTER_OTLP_ENDPOINT: http://tempo:4317
    volumes:
      - ./logs:/var/log/app
    ports:
      - "8000:8000"
    depends_on:
      - tempo

  node-exporter:
    image: prom/node-exporter:v1.9.1
    command:
      - --path.rootfs=/host
    volumes:
      - /:/host:ro,rslave
    pid: host

volumes:
  prom-data:
  loki-data:
  tempo-data:
  alloy-data:
  grafana-data:
Two details worth calling out:
./logsis a host bind mount shared bydemo-app(read-write) andalloy(read-only). If you give the app a named volume and give Alloy the host path instead, Alloy reads an empty directory and Loki stays silent.node-exporterneedspid: hostand a/hostrootfs mount to report accurate host-level metrics rather than container metrics.
Validate before starting:
docker compose config --quiet && echo "compose file is valid"
7. Start the stack
docker compose pull
docker compose up -d --build
docker compose ps
All seven services should report running:
alloy         running   Up 2 minutes
demo-app      running   Up 2 minutes
grafana       running   Up 2 minutes
loki          running   Up 2 minutes
node-exporter running   Up 2 minutes
prometheus    running   Up 2 minutes
tempo         running   Up 2 minutes
Wait for readiness. Tempo and Loki both report 503 for the first 15 seconds while their ingesters settle, which is normal:
sleep 45
for u in 9090/-/ready 3100/ready 3200/ready; do
  printf "%-16s %s\n" "$u" "$(curl -s -o /dev/null -w '%{http_code}' http://localhost:${u})"
done
curl -s http://localhost:3000/api/health
9090/-/ready     200
3100/ready       200
3200/ready       200
{ "database": "ok", "version": "13.2.1", "commit": "56cd3e9288d8255fecebe5d05b48d191f50674b5" }
8. Generate traffic and verify each signal
Drive the checkout endpoint so there’s something to look at:
for i in $(seq 1 200); do curl -s -o /dev/null http://localhost:8000/checkout; done
sleep 30
Metrics — the counters and percentiles should be non-zero:
curl -s -G http://localhost:9090/api/v1/query \
  --data-urlencode 'query=sum(demo_requests_total)' | python3 -m json.tool

curl -s -G http://localhost:9090/api/v1/query \
  --data-urlencode 'query=histogram_quantile(0.95, sum(rate(demo_request_duration_seconds_bucket[5m])) by (le))'
sum(demo_requests_total) = 957.0
p95 latency             = 1.5
p99 latency             = 2.3
Logs — the ERROR lines should be in Loki:
curl -s -G http://localhost:3100/loki/api/v1/query_range \
  --data-urlencode 'query={job="demo-app"} |= "ERROR"' --data-urlencode 'limit=5'
You should see entries like:
{"level":"ERROR","service":"demo-app","msg":"payment authorization slow path taken"}
Traces — the slow-path traces carry an error status, so TraceQL can select them:
curl -s -G http://localhost:3200/api/search \
  --data-urlencode 'q={ status = error }' --data-urlencode 'limit=5'
803971cbc3f520955b77dc00  GET /checkout  951 ms
5dbabf54d56dd527ec38e3d8  GET /checkout  870 ms
7d7459ddf94b201d148db3bb  GET /checkout  1026 ms
Pull one trace and you can see the span tree with per-span timings:
curl -s http://localhost:3200/api/traces/$TRACE_ID | python3 -m json.tool
GET /checkout      973.77ms  status=UNSET
  checkout         972.51ms  status=ERROR  downstream timeout
    db.query        57.50ms
    payment.authorize 914.48ms
That payment.authorize span is the culprit, and it’s the same operation the p95 spike and the error log both point at.
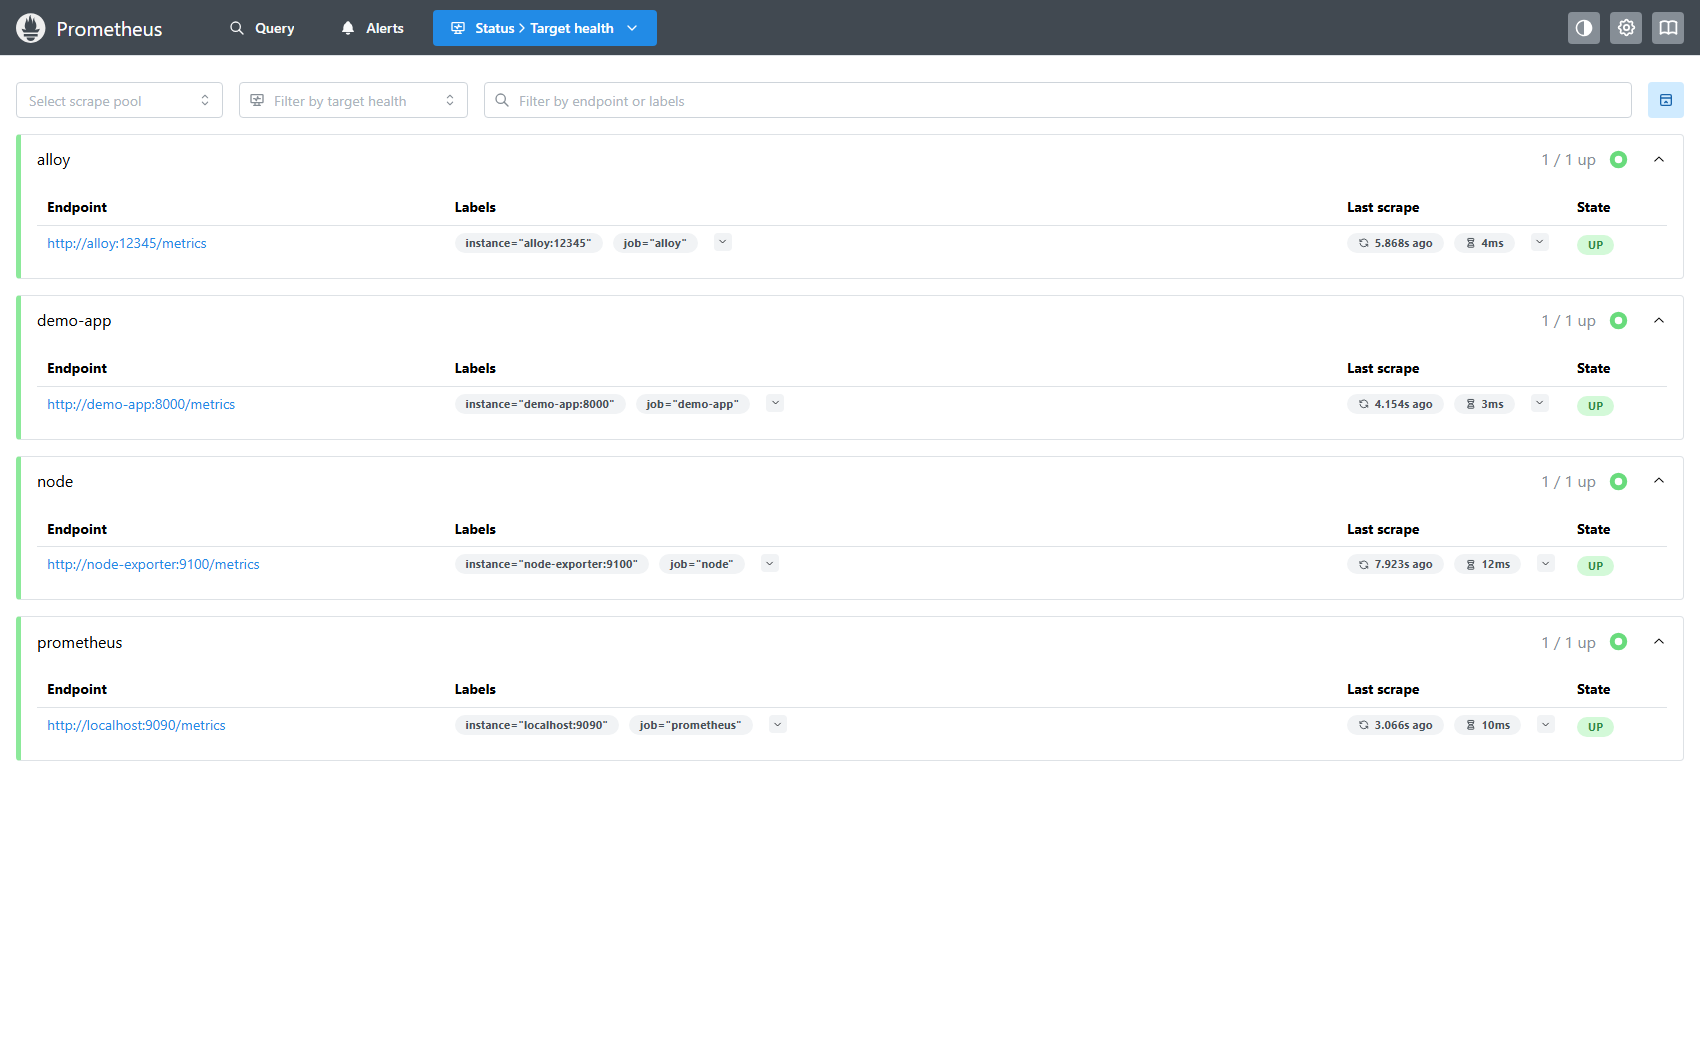
Confirm all four Prometheus targets are healthy:
curl -s http://localhost:9090/api/v1/targets?state=active | \
  python3 -c "import sys,json;[print(t['labels']['job'],t['health']) for t in json.load(sys.stdin)['data']['activeTargets']]"
alloy up
demo-app up
node up
prometheus up
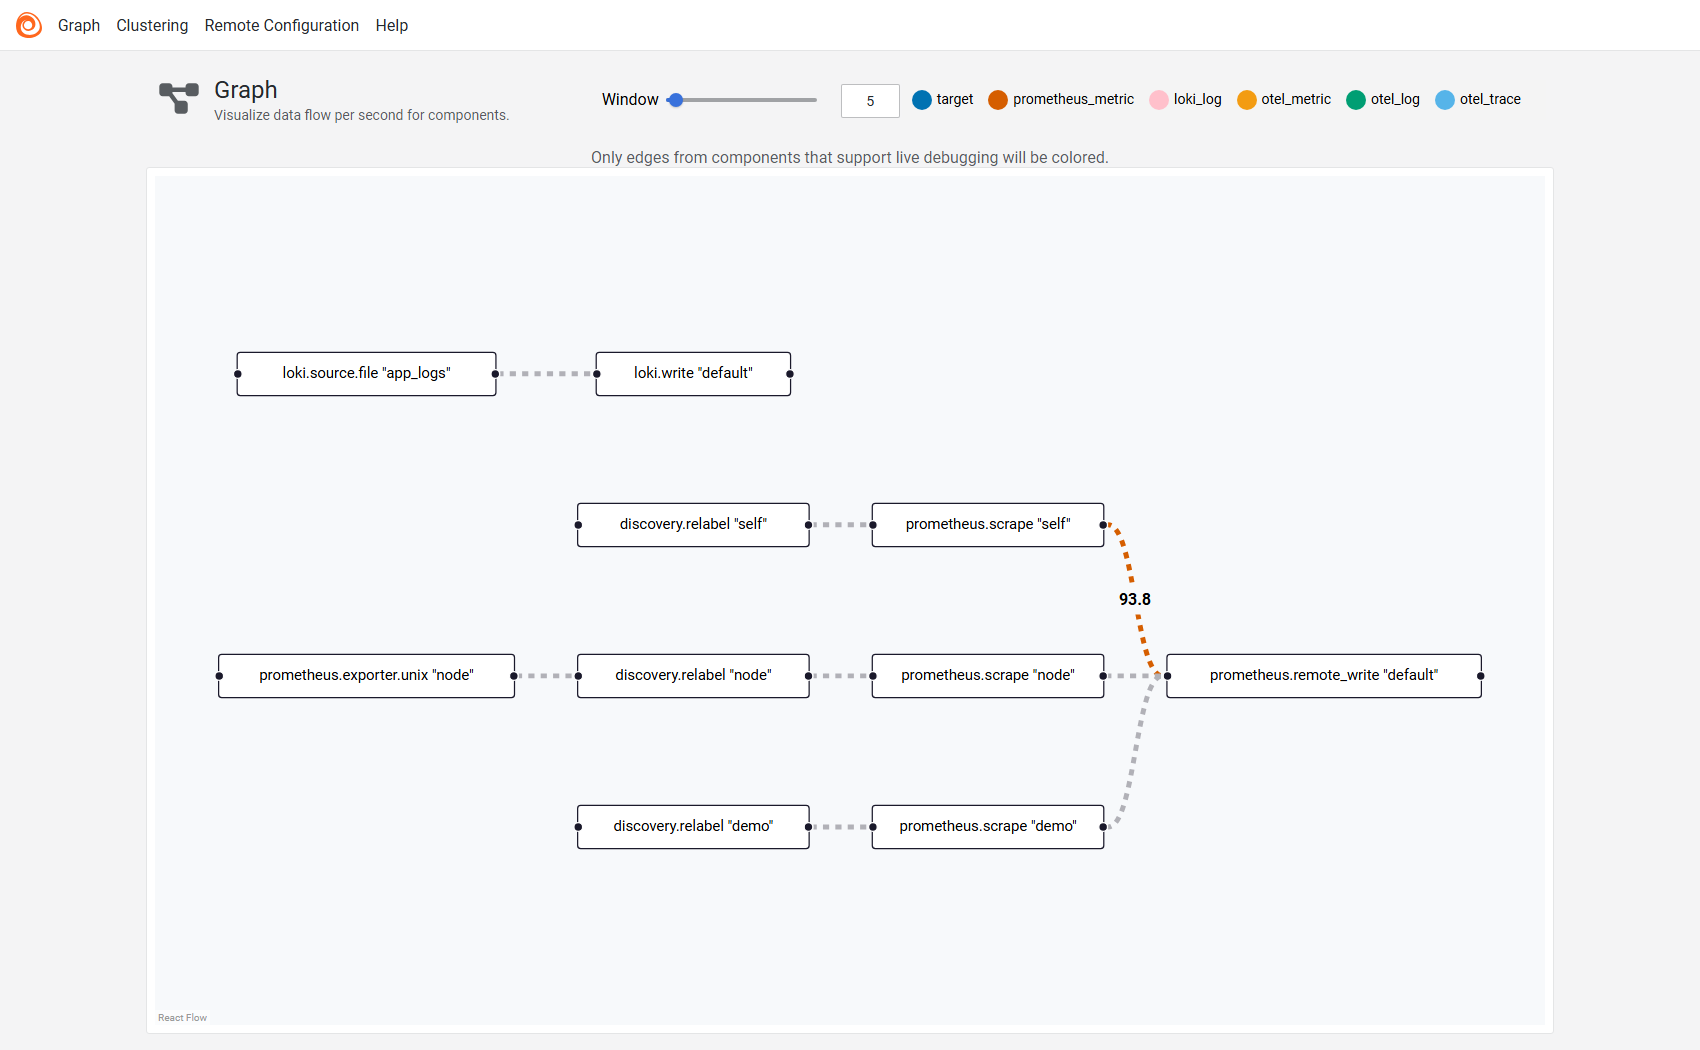
Alloy’s own UI shows the pipeline topology with live sample rates, which is the fastest way to confirm data is moving through each hop:
9. Wire up the Grafana datasources
Add all three so Explore and dashboards can query them:
- Prometheus — type
Prometheus, URLhttp://prometheus:9090, tick Default - Loki — type
Loki, URLhttp://loki:3100 - Tempo — type
Tempo, URLhttp://tempo:3200
On the Tempo datasource, set TraceQL and turn on Node Graph for the service map. The important setting is Trace to logs: point it at the Loki datasource, enable Filter by trace ID, and tag it with service.name = demo-app. That single setting is what makes the jump from a failing span to its log lines work.
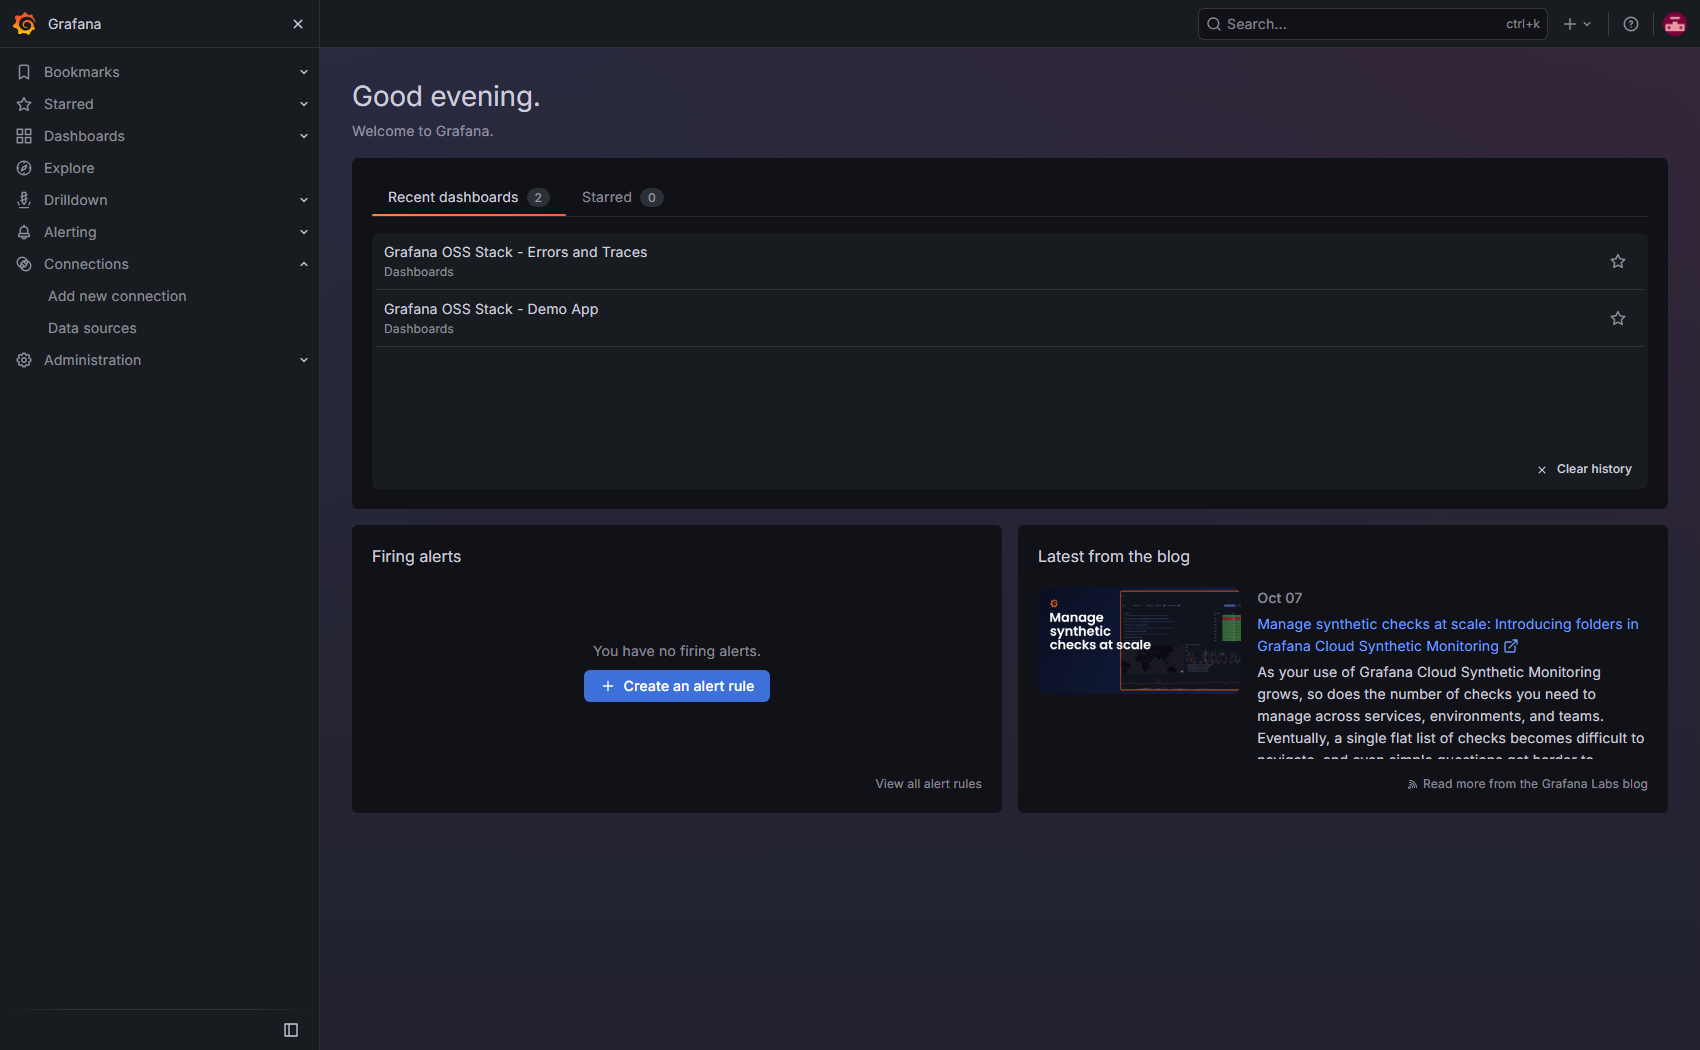
Open http://localhost:3000 and log in with admin / grafstackdemo.
10. Build the dashboard
Create a dashboard with these panels, all reading from the Prometheus datasource unless noted:
# Request rate
sum(rate(demo_requests_total[1m]))

# Totals
sum(demo_requests_total)
sum(demo_failures_total)

# Latency percentiles
histogram_quantile(0.50, sum(rate(demo_request_duration_seconds_bucket[1m])) by (le))
histogram_quantile(0.95, sum(rate(demo_request_duration_seconds_bucket[1m])) by (le))
histogram_quantile(0.99, sum(rate(demo_request_duration_seconds_bucket[1m])) by (le))

# Host resource usage
100 - (avg(rate(node_cpu_seconds_total{mode="idle"}[1m])) * 100)
100 * (1 - node_memory_MemAvailable_bytes / node_memory_MemTotal_bytes)
Add a Logs panel with {job="demo-app"} against Loki, and set the dashboard time range to Last 1 hour with a 10s auto-refresh.
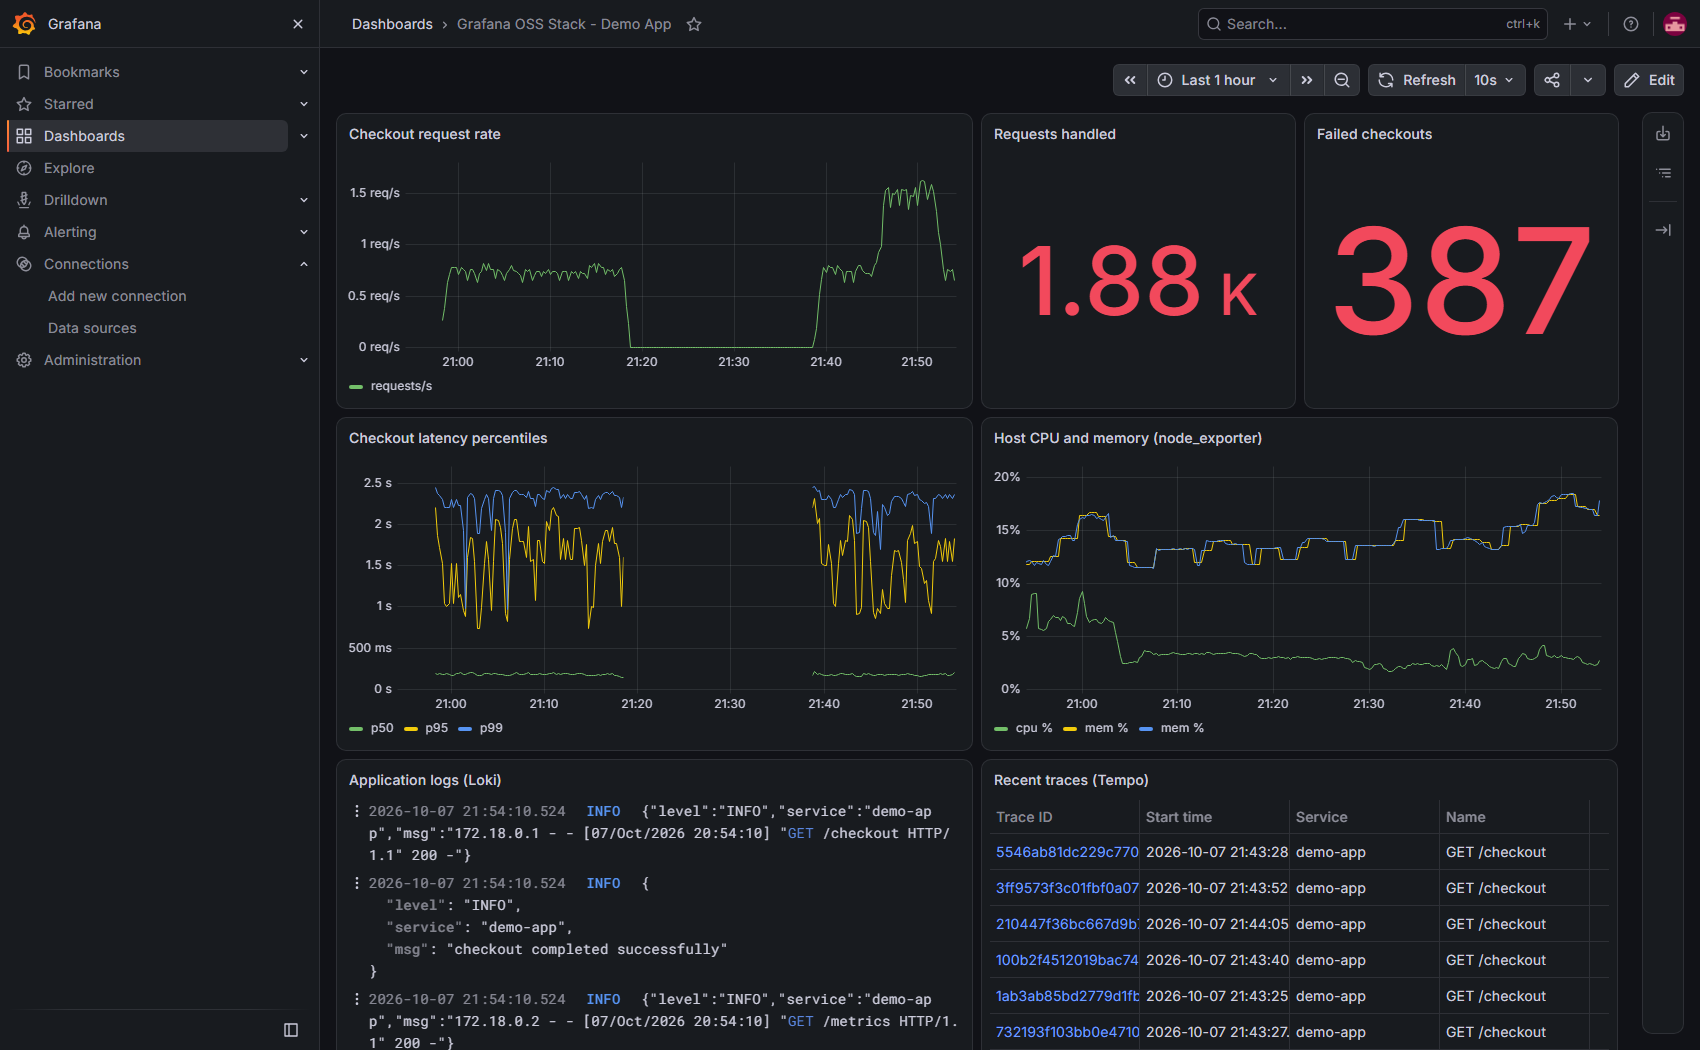
Everything renders at once: 1.88K requests handled, 387 failures, p95 sitting around 1.5s, host CPU and memory from node_exporter, live log lines, and a table of recent traces.
A second dashboard narrows to the failure path — failures per minute from Prometheus, {job="demo-app"} |= "ERROR" from Loki, and { status = error } from Tempo:
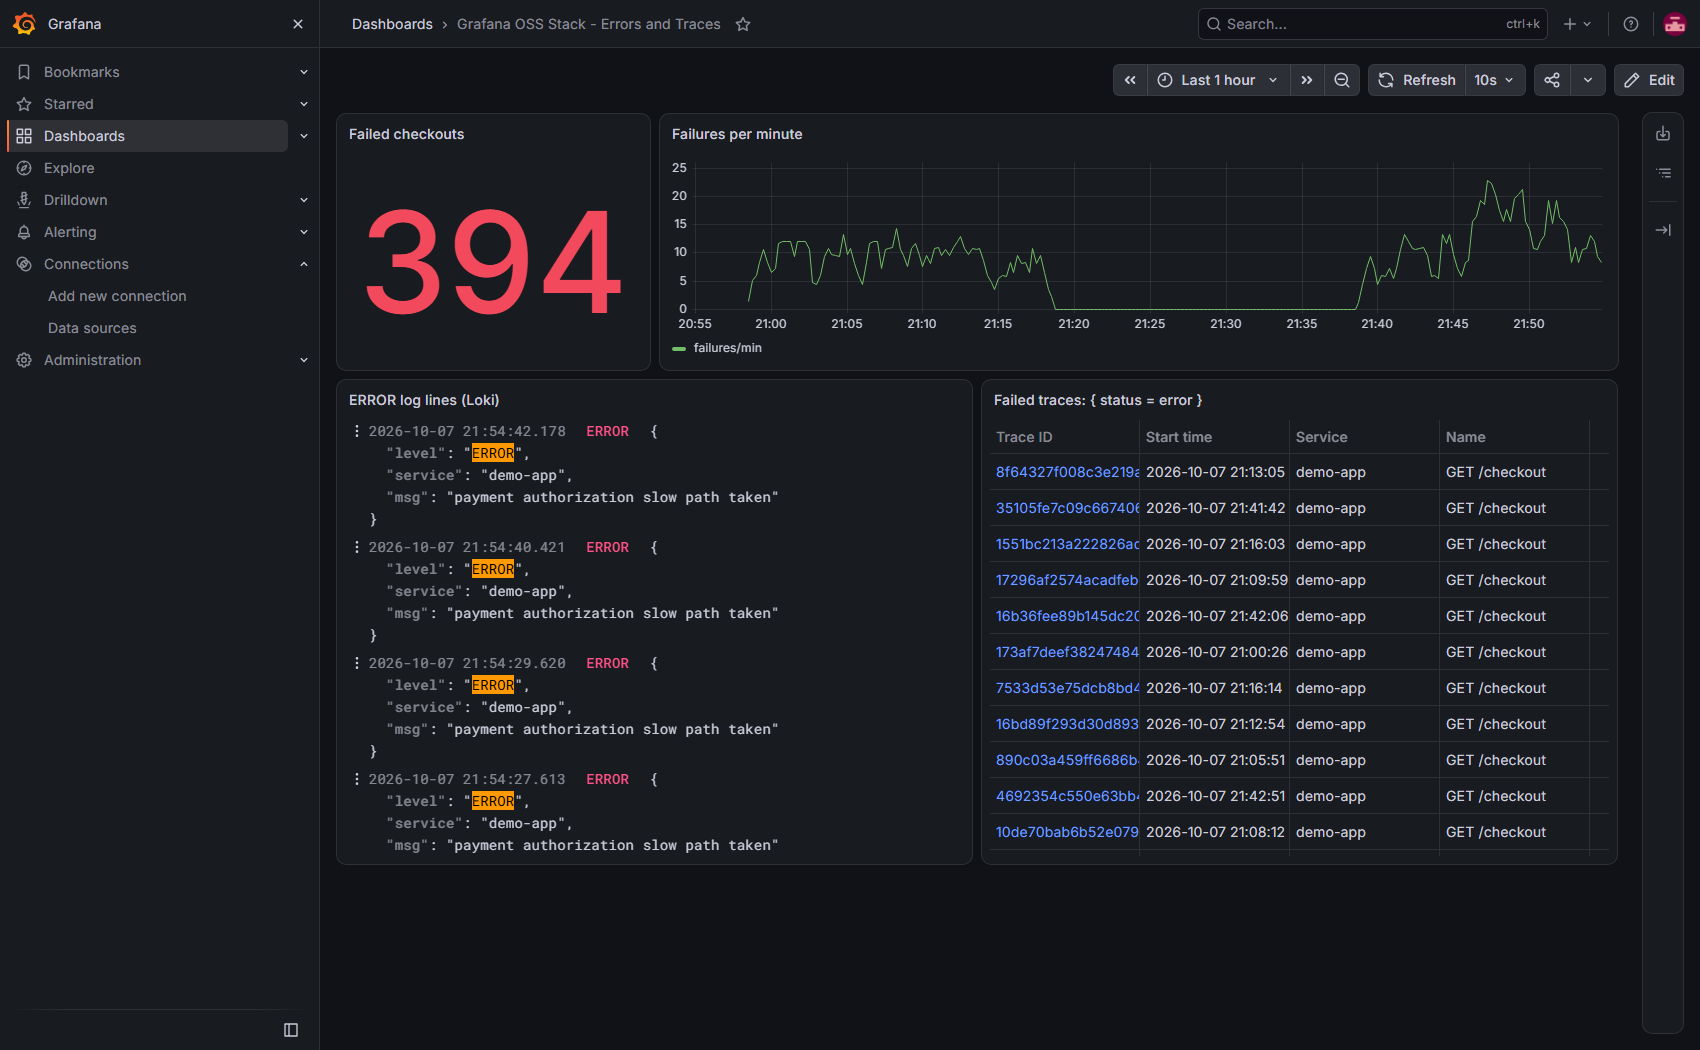
The error log histogram tracks the failure-rate curve closely, which is the correlation you want.
11. Follow one request end to end
This is the payoff. In Explore, pick Tempo and run TraceQL:
{ status = error }
Select the slowest trace. Grafana splits into two panes — the trace on the right, the query on the left:
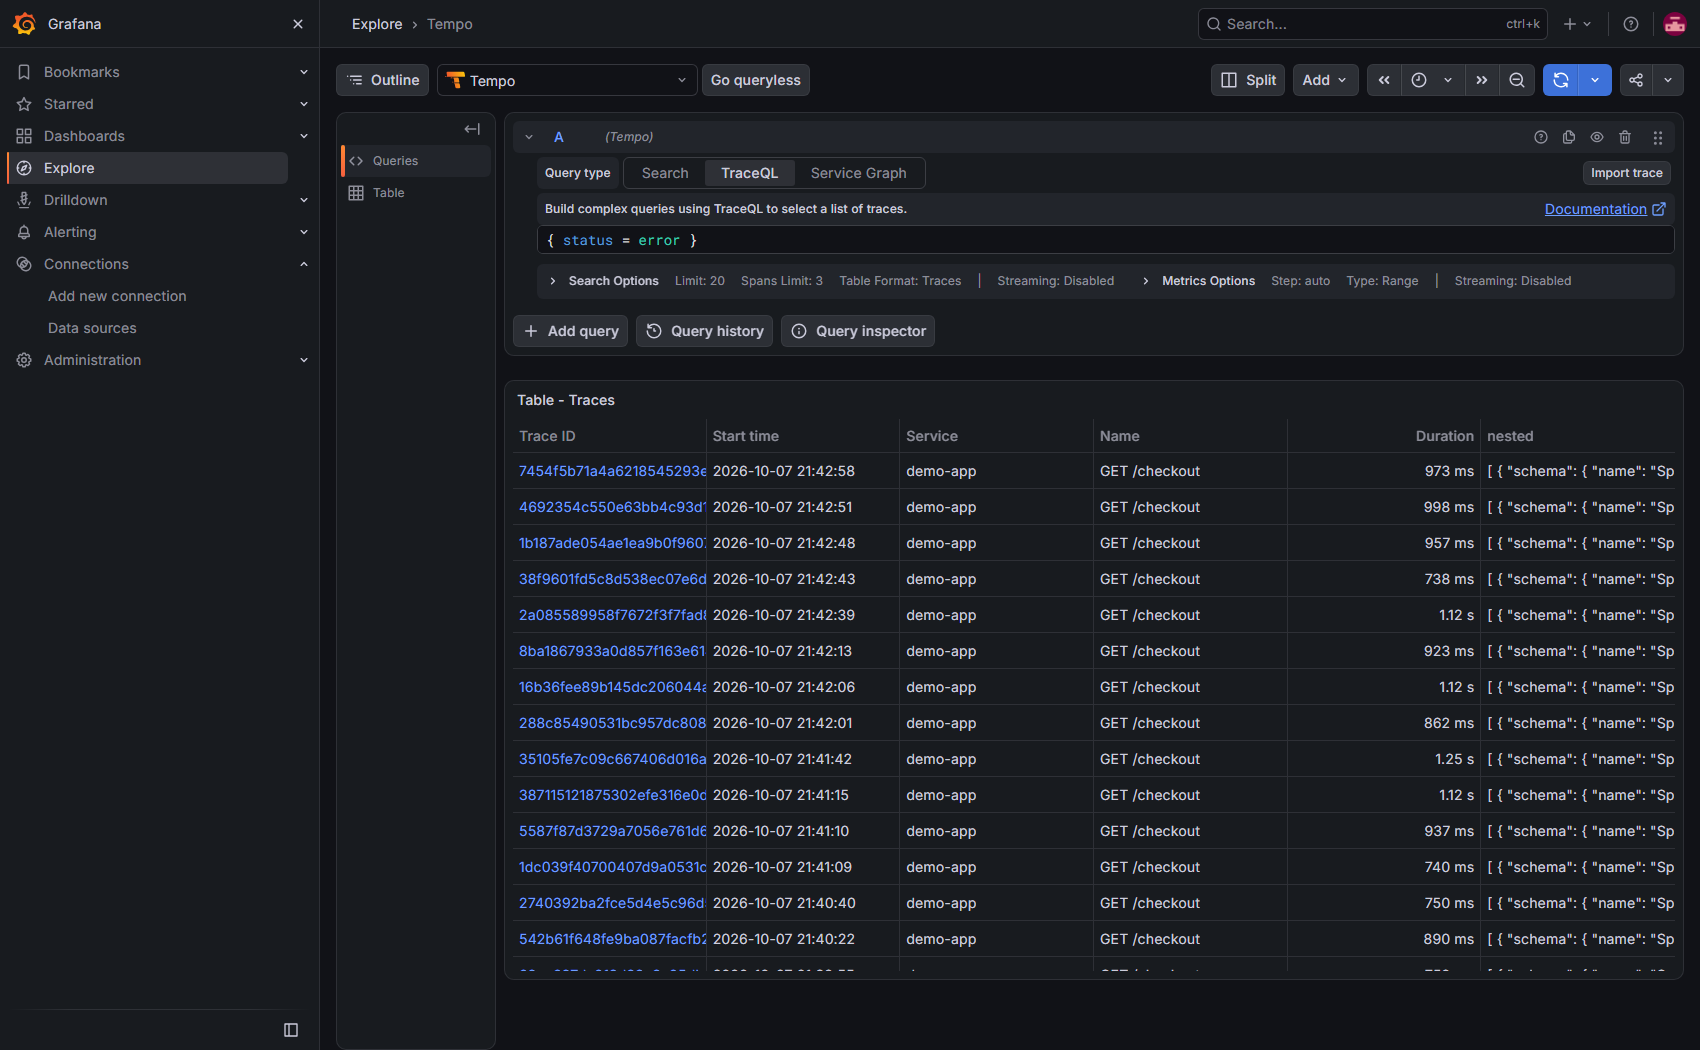
Open one and read the waterfall:
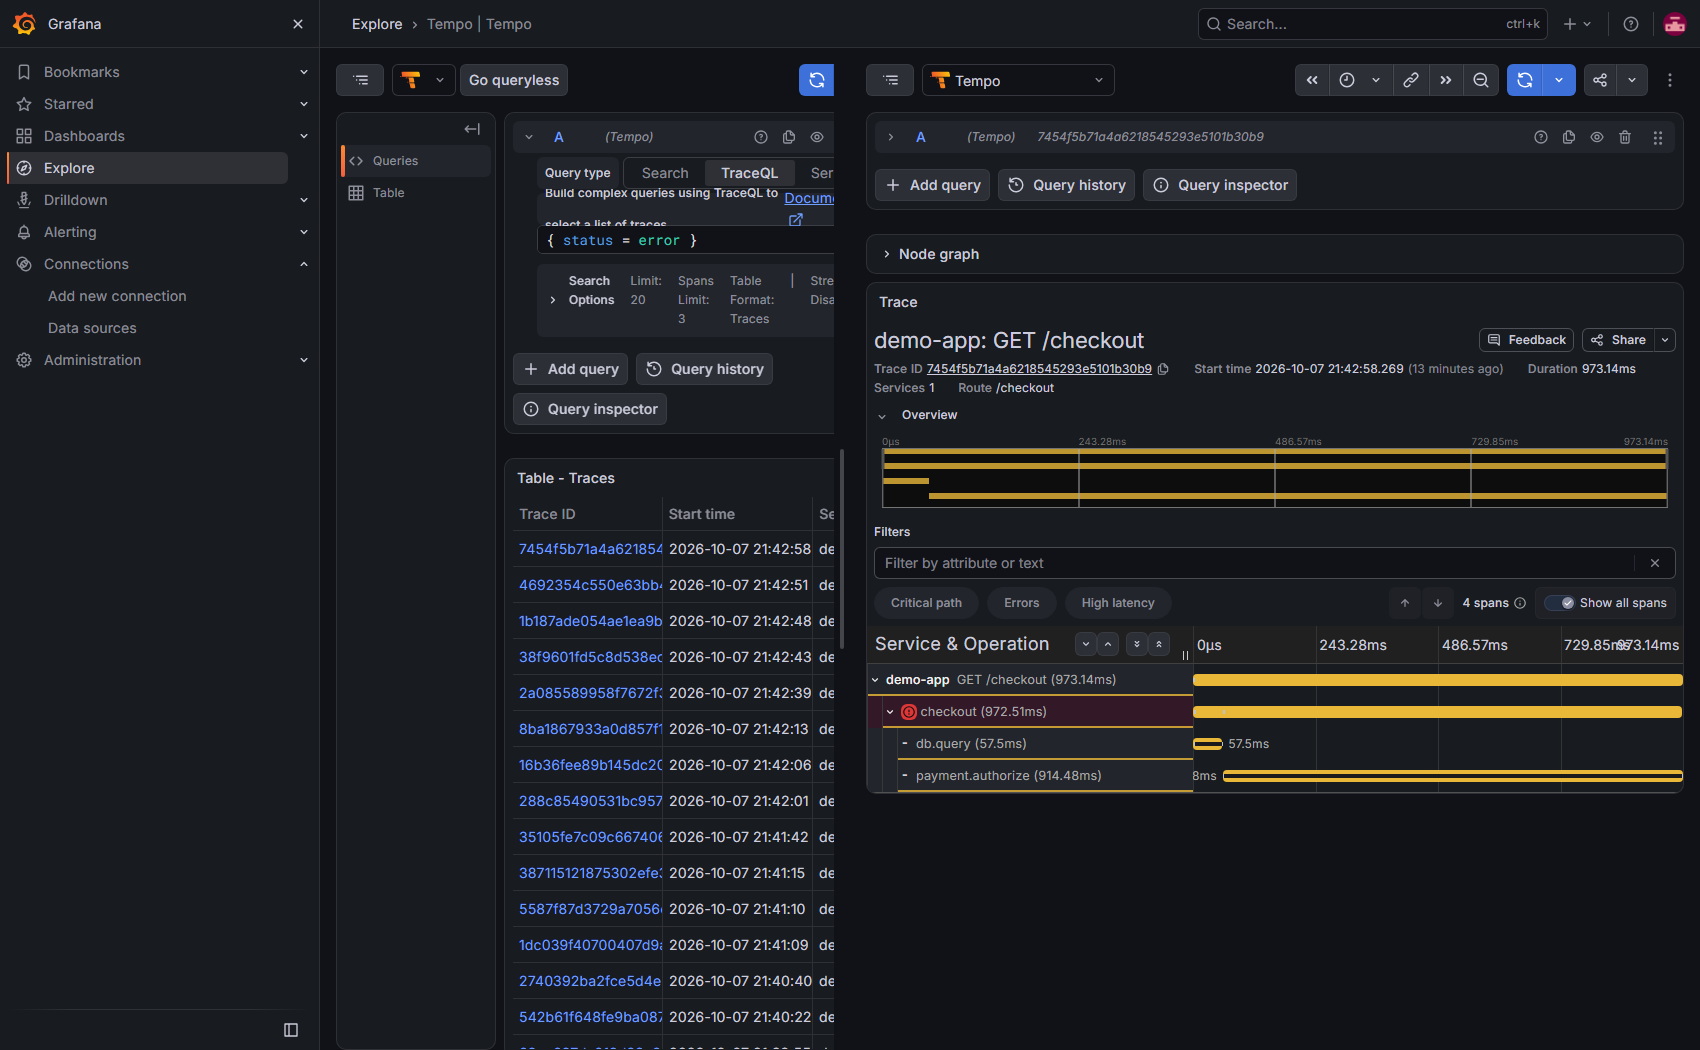
You can read the failure directly off the diagram: the checkout span carries an error icon, and inside it payment.authorize consumed 914.48ms of the 973.14ms total while db.query took only 57.5ms. The bottleneck is unambiguous.
Now switch the left pane to Loki and filter to errors:
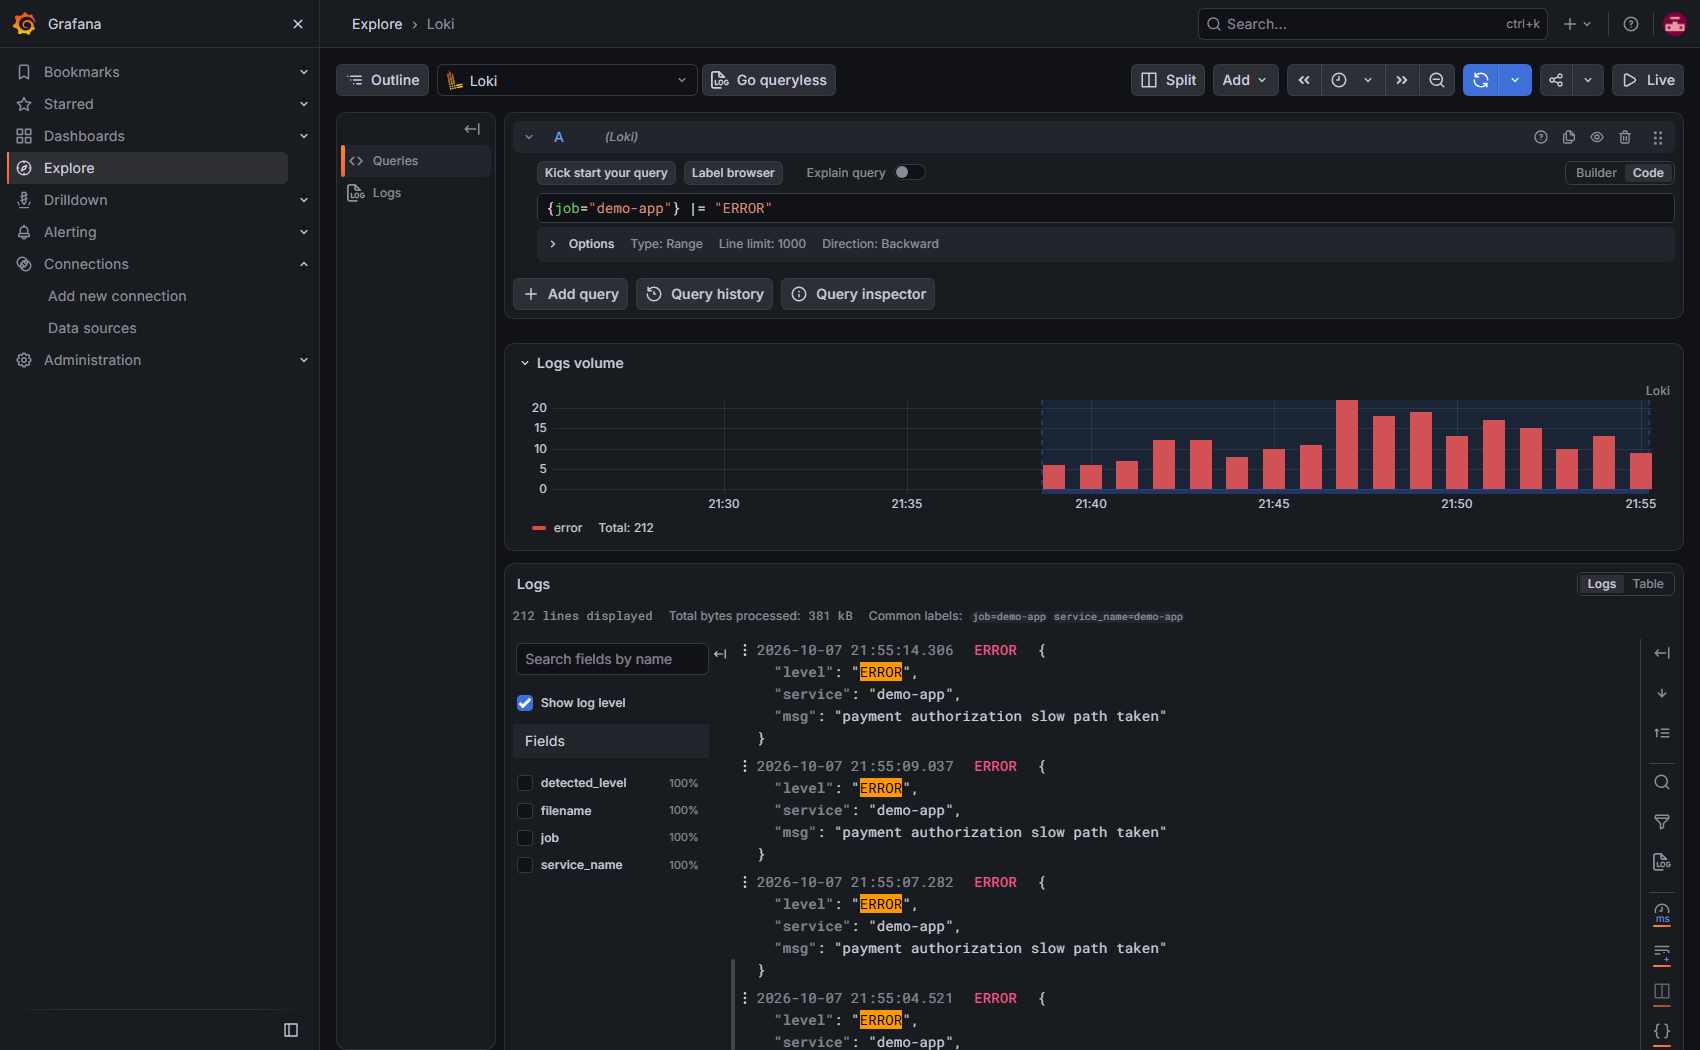
The logs volume histogram and the log stream both show payment authorization slow path taken — the same operation the trace flagged. Metrics said p95 is 1.5s, the trace said payment.authorize is the 914ms span, and the logs said why.
12. Troubleshooting
apt update hangs with no error output. Check whether your Ubuntu archive is resolving to an IPv6-only address:
getent hosts archive.ubuntu.com
curl -4 -sS -o /dev/null -w '%{http_code}\n' http://archive.ubuntu.com/ubuntu/
If DNS returns only IPv6 and you have no IPv6 route, every apt operation against the archives will stall indefinitely rather than fail. Point apt at a reachable mirror:
sudo cp /etc/apt/sources.list.d/ubuntu.sources /etc/apt/sources.list.d/ubuntu.sources.bak
sudo tee /etc/apt/sources.list.d/ubuntu.sources >/dev/null <<'EOF'
Types: deb
URIs: https://mirrors.edge.kernel.org/ubuntu/
Suites: noble noble-updates noble-backports
Components: main restricted universe multiverse
Signed-By: /usr/share/keyrings/ubuntu-archive-keyring.gpg

Types: deb
URIs: https://mirrors.edge.kernel.org/ubuntu/
Suites: noble-security
Components: main restricted universe multiverse
Signed-By: /usr/share/keyrings/ubuntu-archive-keyring.gpg
EOF
sudo apt update
apt fails with Could not get lock /var/lib/dpkg/lock-frontend. Automatic security updates are running. Wait them out:
while pgrep -x apt-get >/dev/null || pgrep -f unattended-upgrade >/dev/null; do sleep 5; done
gpg: dearmoring failed: File exists. A previous attempt left a stale key file. Remove it and retry:
sudo rm -f /etc/apt/keyrings/docker.gpg /etc/apt/keyrings/docker.asc
A Prometheus target shows down. Ask Prometheus what it actually saw:
curl -s 'http://localhost:9090/api/v1/targets?state=active' | \
  python3 -c "import sys,json;[print(t['labels']['job'],'|',t['lastError']) for t in json.load(sys.stdin)['data']['activeTargets']]"
server returned HTTP status 404 NOT FOUND almost always means the metric endpoint isn’t on the port you’re scraping. dial tcp: lookup <name>: server misbehaving means the service name doesn’t resolve on the compose network — check the service name in compose against the target in your scrape config.
Alloy reports component "prometheus.exporter.self.default.targets" does not exist. There’s no prometheus.exporter.self component. Scrape Alloy itself through a plain discovery.relabel block pointing at its HTTP address, as in the config above.
Logs never reach Loki. Confirm Alloy actually sees the file:
docker compose exec alloy ls -la /var/log/app/
docker compose logs alloy | grep -i 'tail file'
A stat failed: no such file or directory means the bind mount is missing — check that both services mount the same host ./logs directory.
Grafana’s Prometheus /targets page returns 404. Grafana 13 removed the built-in targets view from the Prometheus datasource page (only Settings, Permissions, Insights and Cache remain). Use Prometheus’s own UI at http://localhost:9090/targets, shown earlier in this post.
Tempo says Ingester not ready: waiting for 15s after being ready. Normal startup behaviour, not an error. Recheck after ~15 seconds.
Where to Go Next
- Add alerting. Point Prometheus at Alertmanager, or create Grafana alert rules on
sum(rate(demo_failures_total[5m]))to catch the slow path automatically. - Add profiles. Grafana Pyroscope 2.x closes the loop with continuous profiling, so a hot span becomes a hot function. It slots into the same Alloy pipeline.
- Make logs structured. Replace the JSON log lines with plain text and add a Loki
pipeline_stageparser in Alloy — better if you don’t control the app’s log format. - Ship exemplars. With
send_exemplars: trueset on Tempo’smetrics_generator, you can click a spike in a latency graph and jump straight to the trace that caused it. - Scale out. Single-node with filesystem storage works for a lab. Beyond that, swap in Grafana Mimir for metrics and object storage for Loki and Tempo, and run the three as a distributed cluster.
If you’re moving off an older setup, Promtail and Grafana Agent are both end-of-life — Alloy’s migration guide has alloy convert --source-format=promtail for translating an existing Promtail config.